


GROUP PERFORMANCE REVIEW
PACIFIC BASIN DRY BULK SEGMENT
PB TOWAGE SEGMENT
DISCONTINUED OPERATIONS – PB RORO
GROUP PERFORMANCE REVIEW
|
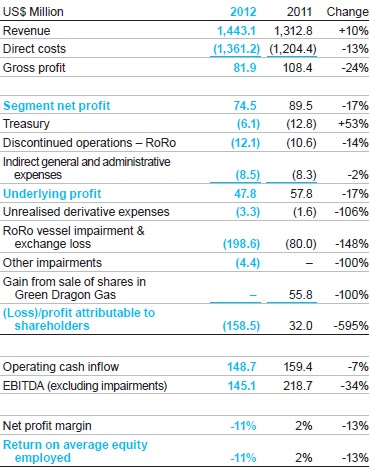
The main influences on our results in 2012 were as follows:
|
|||||||
|
|
|||||||
PACIFIC BASIN DRY BULK SEGMENT
Segment Operating Performance
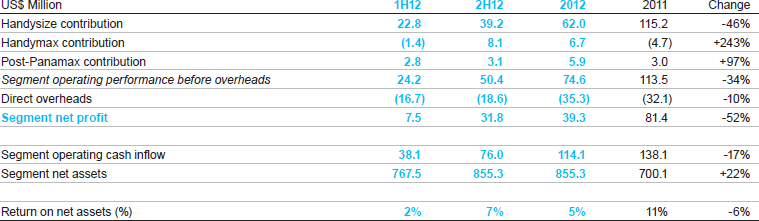
Dry bulk net profit decreased 51.7% to US$39.3 million (2011: US$81.4 million) as the dry bulk freight market suffered from over-supply and remained depressed throughout 2012. However, our second half performance recovered from a weak first half due to stronger TCE earnings coupled with reducing fleet costs as expensive inward charters expired or were renewed at lower hire rates during the year.
Revenue generated by our expanded dry bulk fleet increased 8.2% to US$1,292.4 million (2011: US$1,195.0 million) which represents 89.6% (2011: 91.0%) of our Group's total revenue.
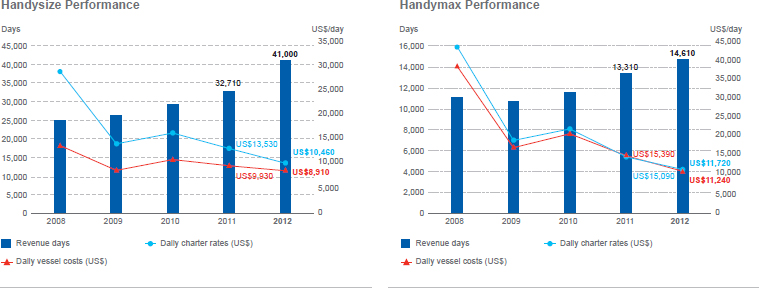
This year saw a substantial growth in the scale of our Handysize and Handymax operations. Handysize revenue days increased 25.3% to 41,000 days (2011: 32,710 days) while Handymax revenue days increased 9.8% to 14,610 days (2011: 13,310 days). This increase was due to the increased number of vessels chartered in on a short term basis.
Daily charter rates for both our Handysize and Handymax vessels were lower than in 2011 due to the continued oversupply of vessels in the global market.
Our dry bulk fleet incurred direct costs (including bunkers and port disbursements) of US$1,238.2 million (2011: US$1,098.5 million) representing 91.0% (2011: 91.2%) of total direct costs.
The depressed market's negative impact on our dry bulk segment net profit was somewhat mitigated by an increase in our spot market operating activities using chartered third-party vessels at lower daily charter rates, hence reducing our blended daily costs.
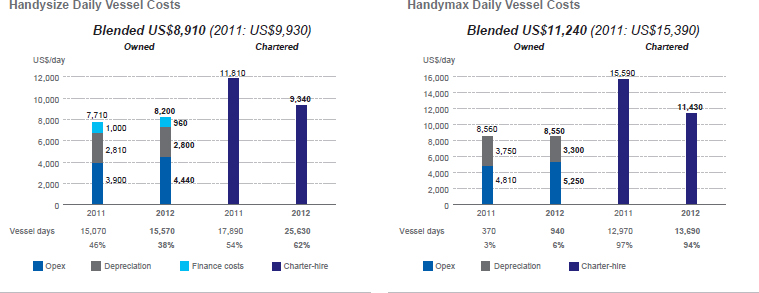
The reduction in chartered-in costs was the main contributor to the reduction in blended daily costs by 10.3% for Handysize and by 27.0% for Handymax vessels. However, daily opex costs for Handysize vessels increased by 13.8% and for Handymax vessels increased by 9.1% due to increased crew wages and travel costs, and higher maintenance costs.
In 2012, we operated 3,850 Handysize vessel days (2011: 670 days) and 1,870 Handymax vessel days (2011: 780 days) on variable chartered-in rates, linked to the Baltic Handysize Index and Baltic Supramax Index.
In 2012, our Handysize chartered-in days increased 43.3% to 25,630 days (2011: 17,890 days) while our Handymax chartered-in days increased 5.6% to 13,690 days (2011: 12,970 days). Chartered days represented 62.2% and 93.6% of our total Handysize and Handymax vessel days respectively, an increase of 7.9% and a decrease of 3.7% year on year respectively.
Our fleet of owned and finance leased dry bulk vessels experienced an average 1.6 days off-hire (2011: 1.2 days) per vessel during the year.
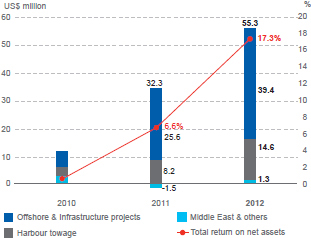
PB TOWAGE SEGMENT
Segment Operating Performance
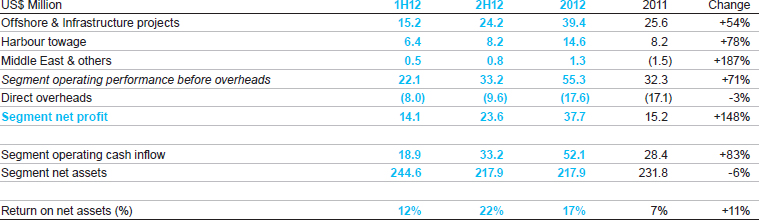
Results from offshore and infrastructure projects improved due to the development of new and expansion of existing projects in the offshore business and consequent increased demand for offshore tugs and barges.
Harbour towage results improved due to increased port calls at Australian container ports.
The Segment's EBITDA (before impairments) amounted to US$53.4 million (2011: US$36.0 million) for the year, which was in line with the operating cash flow.
Towage Segment Operating Performance before Overheads
DISCONTINUED OPERATIONS – PB RORO
Operating Performance
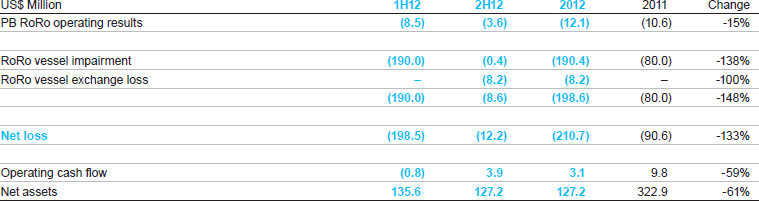
Due to the RoRo market challenges and the consequent downgrade in our RoRo earnings and business outlook, a non-cash impairment charge of US$190.4 million was reflected in the results.
On 6 September 2012, all of our six RoRo vessels were sold for an aggregate consideration of €153 million. The buyer is obliged to purchase at least one vessel by the end of each of the six month periods ending 30 June 2013 through 31 December 2015.
Simultaneously with the signing of the sale agreements, the Group signed bareboat charterparties to charter the vessels to the buyer at agreed charter rates. These charters expire with the purchase and delivery of the vessels to the buyer. The bareboat charters for two vessels commenced in October 2012 and for three vessels commenced in February 2013. The Group expects the bareboat charter of the final vessel to commence in March 2014.
On the date of the sale agreements, the vessels' carrying values were reclassified in the balance sheet as assets held for sale. At the bareboat charter commencement date, the value of assets held for sale of each of the vessels are de-recognised from the balance sheet and corresponding trade receivables recognised in the balance sheet representing the present value of the sale proceeds and charter-hire receipts. At 31 December 2012, the six RoRo vessels had a combined asset value of US$187.8 million, represented by two RoRo vessels on bareboat charter with a value of US$59.7 million shown in other receivables under Treasury, and four RoRo vessels with a value of US$128.1 million shown in assets held for sale under discontinued operations – RoRo. The difference between the gross receivables and the present value of the receivables is recognised as interest income reflecting the time value of money over the periods of the bareboat charters and until the expected date of settlement of the sale consideration by the buyer. The bareboat interest income of US$0.7 million in 2012 is shown under Treasury.
The Group maintains a foreign exchange reserve for the translation to US Dollars of the Euro-denominated net asset value of the vessel owning companies. Each vessel disposal will result in the release of the cumulative foreign exchange reserve relating to each vessel owning company to the consolidated income statement at the bareboat commencement date. The amount realised in 2012 was US$8.2 million.
The current estimated future financial effect of the RoRo disposal transaction is as follows:

Note: The exchange losses relate to the foreign exchange reserve for the translation to US Dollars of the Euro-denominated net asset value of the RoRo companies. Such cumulative foreign exchange reserve will be released to the consolidated income statement at the bareboat commencement dates. The estimated Euro-denominated interest income is translated into US Dollars at the 2012 year-end rate of EUR 1 to US$ 1.3231.
