

CASH FLOW AND CASH
BORROWINGS
FINANCE COSTS
DELIVERED VESSELS
VESSEL COMMITMENTS
VESSEL LEASE COMMITMENTS
CASH FLOW AND CASH
The Group's four main sources of capital are equity, convertible bonds, bank loans and operating cash flows.
The Treasury function actively manages the cash, borrowings and commitments of the Group to ensure sufficient funds are available and an appropriate level of liquidity is maintained during different stages of the shipping cycle to meet all its obligations. This is part of the ordinary activities of the Group.
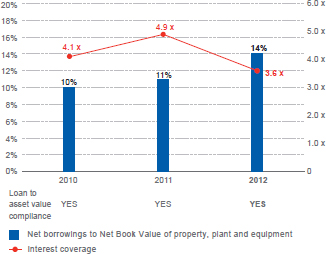
Over the long term, the Group aims to maintain a conservative consolidated net gearing of no greater than 50% – defined as the ratio of net borrowings to the Net Book Value of property, plant and equipment – which we believe is sustainable over different stages of the shipping cycle.
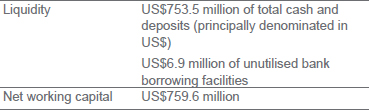
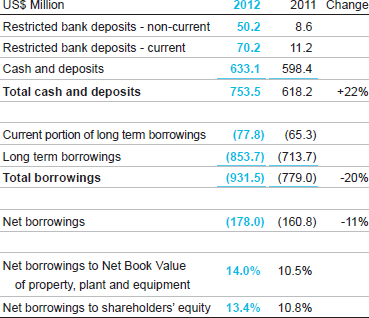
As at 31 December 2012, the Group had a strong cash position of US$753.5 million resulting in a 14.0% net gearing ratio. The Group has sufficient cash resources on hand to fund its capital commitments at 31 December 2012 of US$235.9 million.
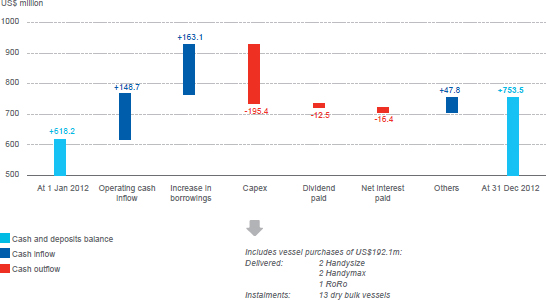
Cash Flow
The major factors influencing future cash balances are expected to be operating cash flows, purchases of dry bulk vessels, sale of assets, and drawdown and repayment of borrowings.
Net Borrowings to NBV and Interest Coverage
2012 Sources and Uses of Group Cash Flow
Cash and Deposits
Treasury is permitted to invest in a range of cash and investment products subject to limits specified in the Board approved Group Treasury Policy. These include overnight and term deposits, money market funds, liquidity funds, structured notes, and currency linked deposits.
Treasury enhances Group income through investing in a mix of financial products, based on the perceived balance of risk, return and liquidity, while ensuring that cash can be readily deployed to meet the Group's commitments and needs.
Cash, deposits and investment products are placed with a range of leading banks, mainly in Hong Kong. Restricted bank deposits relate to i) additional collateral pledged to maintain dry bulk bank lending covenants and ii) guarantees issued for offshore and infrastructure projects in the Towage segment.
The split of current and long-term cash, deposits and borrowings is presented as follows:
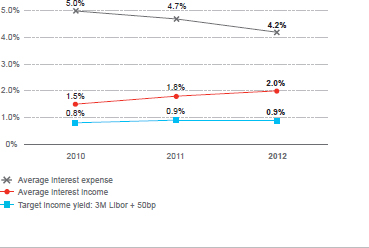
During the year, Treasury achieved 2.0% return on the Group's cash. Interest income is benchmarked against a target yield of 50 basis points above 3 month US Dollar LIBOR.
Interest Rates and Benchmark Income
US$ Value of Currencies at 31 December 2012
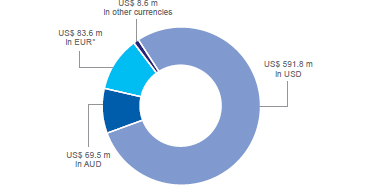
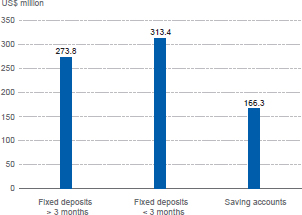
At 31 December 2012, the Group's US$753.5 million total cash and deposits were placed in the following investment products:
Cash and Deposits Investments
BORROWINGS
The Group's Treasury function arranges financing by leveraging the Group's balance sheet to optimise the availability of cash resources of the Group. Borrowings comprise:The aggregate borrowings of the Group amounted to US$931.5 million (2011: US$779.0 million). They are principally denominated in United States Dollars, except for bank loans equivalent to US$31.1 million (2011: US$34.4 million) which are denominated in Australian Dollars.
Bank Borrowings
Bank borrowings (net of deferred loan arrangement fees) were US$465.1 million (2011: US$405.5 million) at 31 December 2012, having increased as loans secured on Handysize vessels were drawndown during the year.
Bank borrowings are in the functional currency of the business segment to which they relate. Subsequent to the sale of our RoRo vessels, the existing EUR162 million, 12-year RoRo loan facility was converted to a dry bulk loan facility of approximately US$210 million, thus further enhancing our dry bulk vessel buying power.
The Group monitors the loans to asset value requirements on its bank borrowings. If the market values of the Group's mortgaged assets fall below the level prescribed by our lenders, the Group pledges additional cash or offers additional unmortgaged vessels as collateral to them.
As at 31 December 2012:
i) The Group's bank borrowings were secured by mortgages over 45 vessels with a total net book value of US$695.6 million and an assignment of earnings and insurances in respect of these vessels. The Group had 42 unmortgaged vessels with a total net book value of US$383.2 million.
ii) The Group was in compliance with all its loans to asset value requirements.
iii) The Group had unutilised bank borrowing facilities of US$6.9 million.
|
P/L impact: |
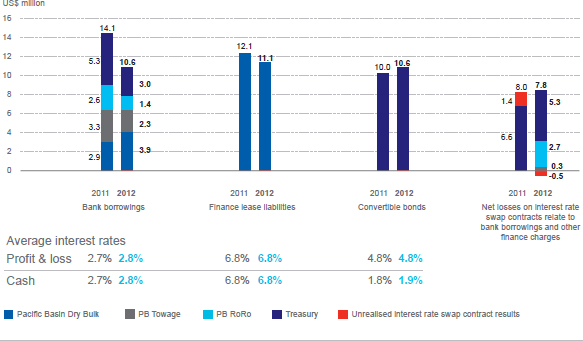
The decrease of US$3.5 million in interest on bank borrowings (after capitalisation) to US$10.6 million was mainly due to an increase in interests capitalised to undelivered newbuild vessels from US$1.3 million to US$3.6 million. Bank borrowings are subject to floating interest rates but the Group manages these exposures by way of entering into interest rate swap contracts. |
|
Borrowings by Source and Segment
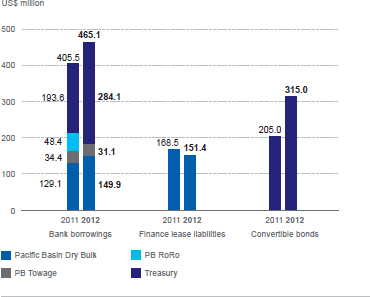
Finance Lease Liabilities
Finance lease liabilities decreased following scheduled repayments during the year. Finance lease liabilities are allocated to the segment in which assets are owned.
Aggregate current and long term finance lease liabilities at 31 December 2012 were US$151.4 million (2011: US$168.5 million) relating to 13 Handysize vessels whose bareboat charters expire between 2015 and 2017. The fixed, equal, quarterly charter-hire payments are accounted for as a combination of repayments of finance lease liabilities on the balance sheet and finance charges in the income statement. Finance charges can be expressed as interest rates, fixed for the period of the leases.
|
P/L impact: |
Finance charges of US$11.1 million (2011: US$12.1 million) represent interest payments on the Handysize vessels under finance leases. |
|
Convertible Bonds
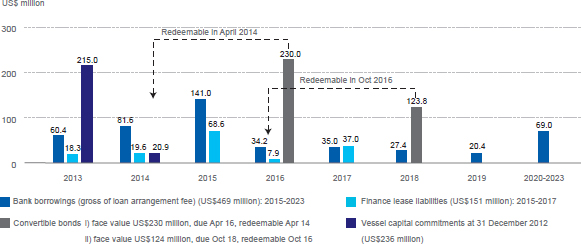
In September 2012, the Group issued convertible bonds of US$123.8 million with 1.875% per annum coupon maturing in 2018. The new bonds are convertible into ordinary shares of the Company at a current conversion price of HK$4.96.
The debt components of the Group's 1.75% p.a. coupon April 2016 convertible bonds and 1.875% p.a. coupon October 2018 convertible bonds were US$315.0 million (2011: US$205.0 million) at 31 December 2012.
|
P/L impact: |
The US$10.6 million interest expense of the convertible bonds is calculated at an effective interest rate of 4.8%. |
|
FINANCE COSTS
Total finance costs of US$40.1 million (2011: US$44.2 million) comprised finance costs from continued operations of US$36.0 million (2011: US$41.6 million) and finance costs from discontinued RoRo operation of US$4.1 million (2011: US$2.6 million).
The key indicators on which management focuses to assess the cost of borrowings are:
- Average interest rates for the sources of borrowings (See "Finance Costs by Source and Segment" below)
- Group Interest Coverage

Group Interest Coverage is calculated as EBITDA divided by total gross finance costs. |
The Group aims to achieve a balance between floating and fixed interest rates on its long term borrowings, using interest rate swap contracts where appropriate. As at 31 December 2012, 8% of the Group's long term borrowings were subject to floating rates. The Group monitors this to maintain an appropriate floating to fixed interest rate ratio which is adjusted from time to time depending on the shipping and interest rate cycles.
Finance Costs by Source and Segment
Schedule of Repayments and Vessel Capital Commitments
DELIVERED VESSELS
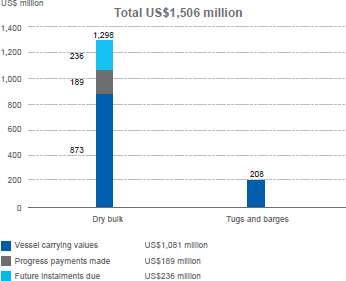
At 31 December 2012, the Group had property, plant and equipment with a net book value (after RoRo impairment) of US$1,270.2 million, related to the following delivered vessels:
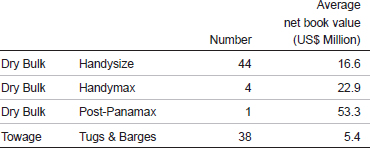
Handysize vessels continued to dominate the Group's assets with an average age of 8.4 years for the delivered owned vessels. Tugs and barges are denominated in their functional currencies of the Australian Dollar, and hence their US Dollar carrying values and commitments are subject to exchange rate fluctuations.
A Combined View of Vessel Carrying Values and Vessel Commitments at 31 December 2012
VESSEL COMMITMENTS
As at 31 December 2012, the Group had non-cancellable vessel commitments of US$201.2 million and authorised commitments of US$34.7 million. This reflects the cost of the eight dry bulk vessels purchased since September 2012 for US$121.8 million. The vessels are scheduled to deliver to the Group between January 2013 and January 2014 as shown in the table.
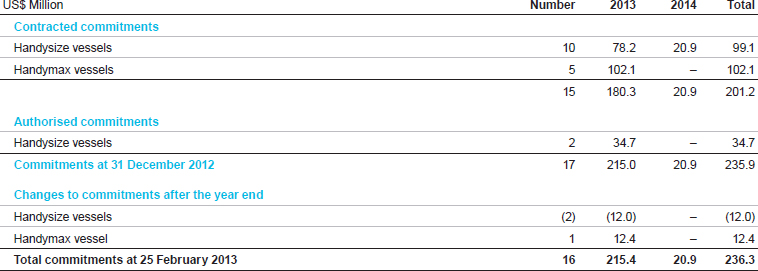
These commitments, along with other potential vessel acquisitions, will be financed by a combination of cash generated by the Group's operations, existing cash and additional long term borrowings to be arranged as required. Where the commitments are in currencies other than the functional currencies of the underlying assets, the Group has entered into forward foreign exchange contracts to purchase the currencies at predetermined rates.
VESSEL PURCHASE OPTIONS
Certain lease agreements provide the Group with options to purchase the related vessels at predetermined times and prices during the lease periods. The average price of the existing purchase options for the Group's vessels in the earliest years in which these options may be exercised, along with the number of vessels and the average age of such vessels in those years, are as follows:
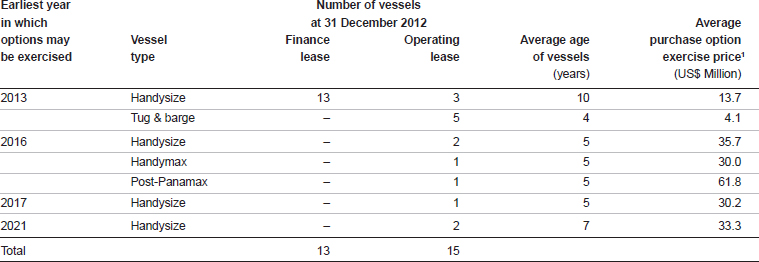
Note 1: Includes certain purchase options priced in Japanese Yen.
Estimated fair market values published by Clarksons are US$17.0 million and US$18.5 million for 5 year old 32,000 dwt Handysize and 56,000 dwt Handymax vessels respectively.
VESSEL LEASE COMMITMENTS
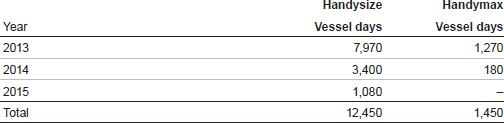
The following table shows the average contracted daily charter rates and total number of vessel days remaining for our Handysize and Handymax vessels chartered in under operating leases and finance leases in each year of the lease term, assuming the purchase options will not be exercised until the expiry of the charter-hire agreements.
Handysize and Handymax Vessel Lease Commitments
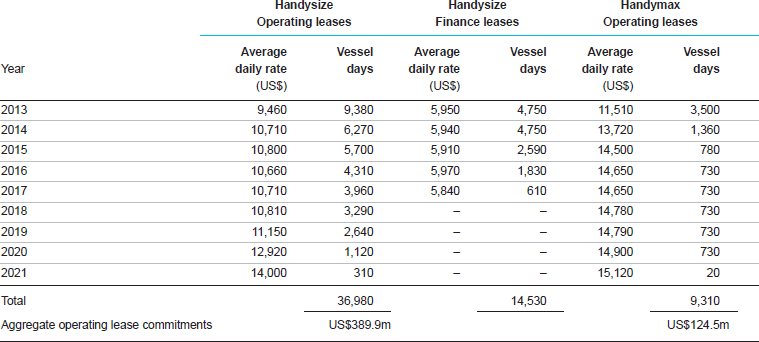
Vessel operating lease commitments stood at US$573.2 million (2011: US$573.4 million), comprising: US$389.9 million for Handysize; US$124.5 million for Handymax; US$55.8 million for Post-Panamax vessels; and US$3.0 million for tugs. Operating lease commitments remained largely unchanged as lower charter rates for chartered-in Handysize and Handymax vessels were offset by the increase in the number of charter days. Our Handysize operating lease committed days increased 11.1% to 36,980 days (2011: 33,300 days) while our Handymax operating lease committed days increased 2.8% to 9,310 days (2011: 9,060 days).
Vessel finance lease commitments are included as part of property, plant and equipment.
In addition to the above, there are vessel operating lease commitments that are on variable charter rates, linked to the Baltic Handysize Index for Handysize vessels and the Baltic Supramax Index for Handymax vessels.